> ## Documentation Index
> Fetch the complete documentation index at: https://wb-21fd5541-sdk-testing-latest.mintlify.site/llms.txt
> Use this file to discover all available pages before exploring further.
> 折れ線グラフでは、スムージングを使用してノイズの多いデータの傾向を把握できます。
# 折れ線グラフのスムージング
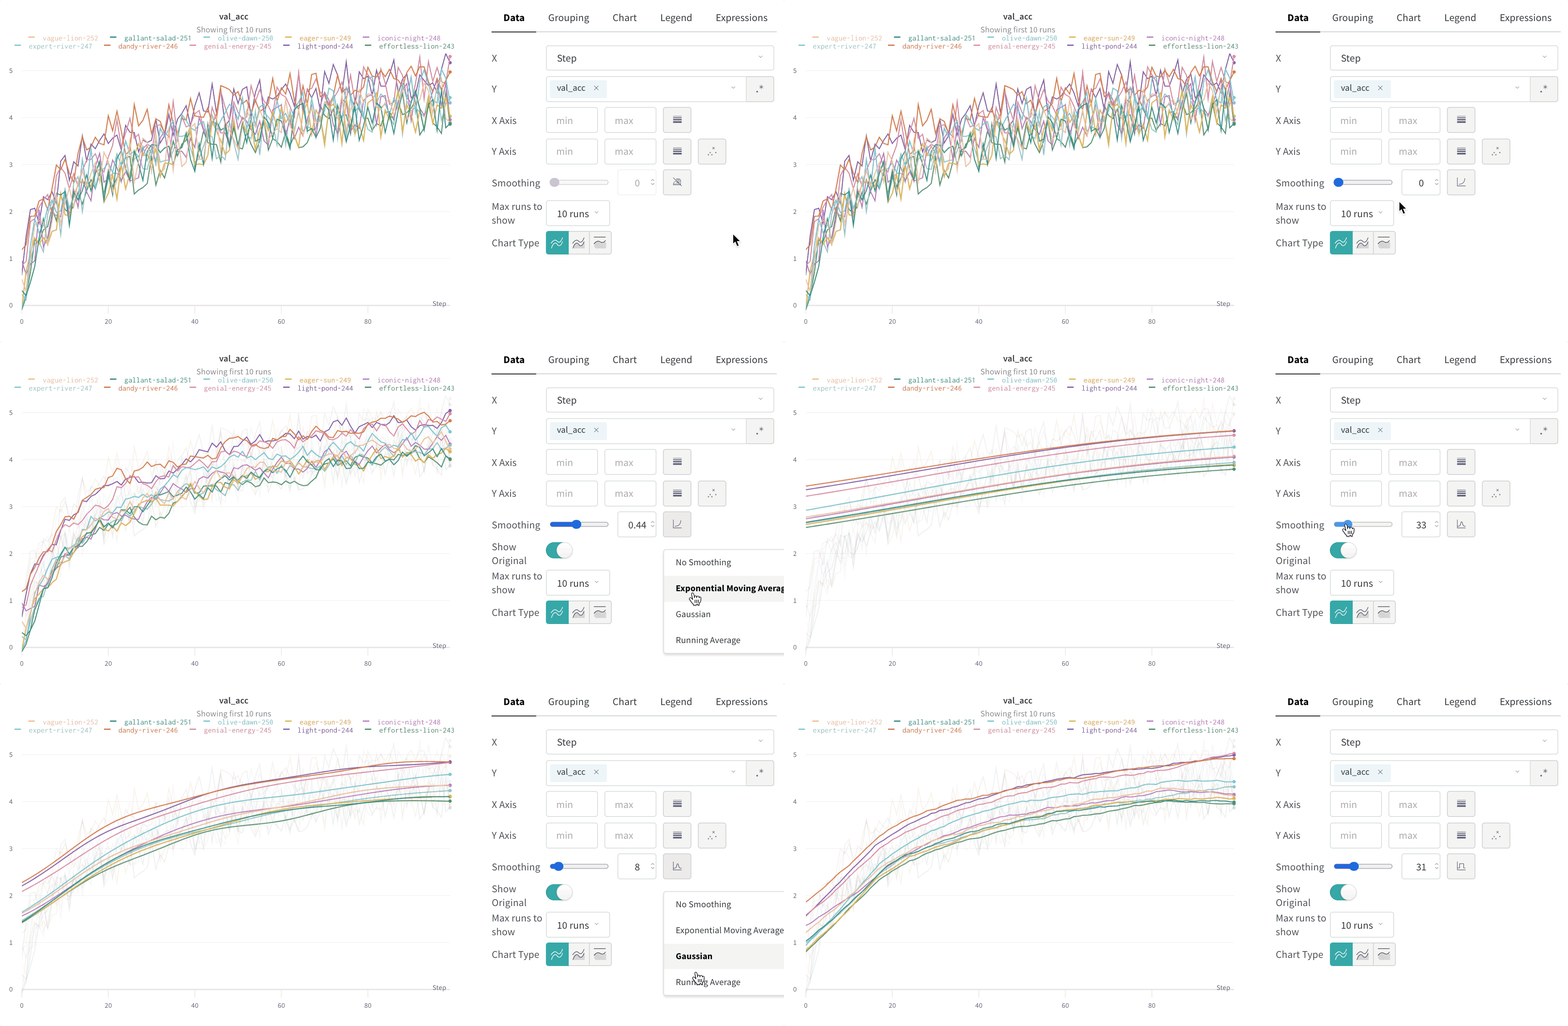
スムージングは、点ごとのばらつきを抑えることで、ノイズの多い折れ線グラフでも傾向を見つけやすくし、背後にある信号を読み取りやすくします。このページでは、W\&B がサポートするスムージング アルゴリズム、それぞれが特に有効な場面、および元のデータを表示したままにするかどうかを制御する方法について説明します。
W\&B は複数のタイプのスムージングをサポートしています。
* [時間加重指数移動平均 (TWEMA) スムージング](#time-weighted-exponential-moving-average-twema-smoothing-default)
* [ガウススムージング](#gaussian-smoothing)
* [移動平均](#running-average-smoothing)
* [指数移動平均 (EMA) スムージング](#exponential-moving-average-ema-smoothing)
これらのアルゴリズムが実際のデータに適用される様子は、[インタラクティブな W\&B report](https://wandb.ai/carey/smoothing-example/reports/W-B-Smoothing-Features--Vmlldzo1MzY3OTc)で確認できます。
## 時間加重指数移動平均 (TWEMA) スムージング (デフォルト)
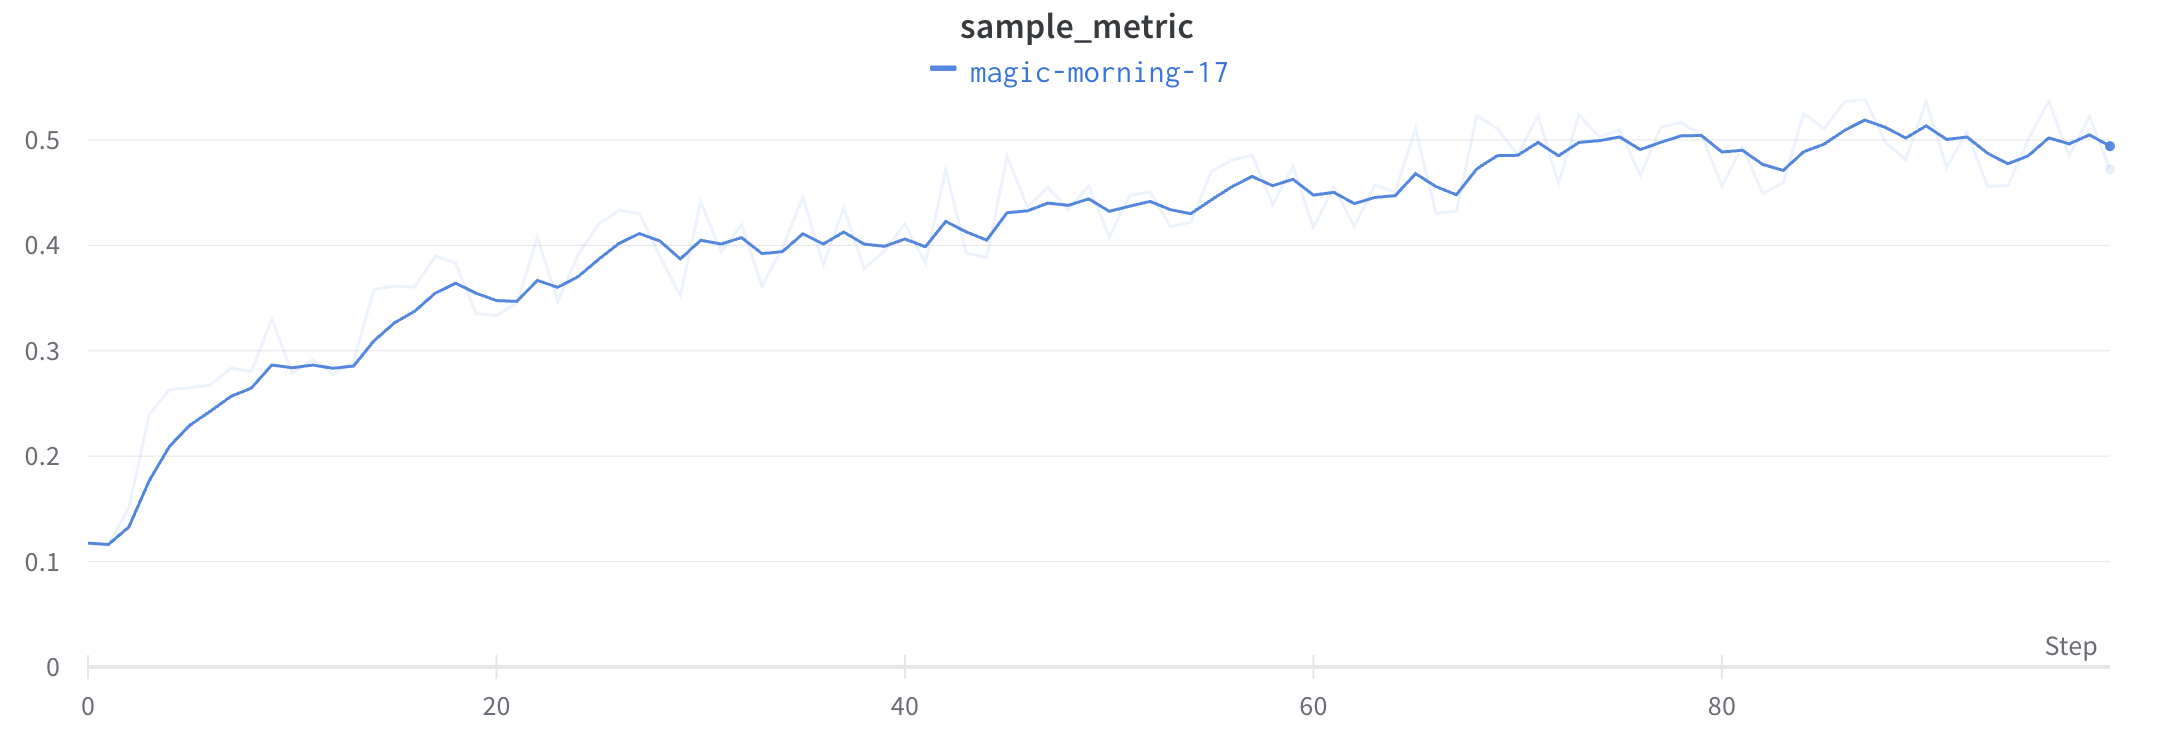
時間加重指数移動平均 (TWEMA) スムージング アルゴリズムは、過去の点の重みを指数関数的に減衰させることで、時系列データを平滑化する手法です。手法の詳細については、[Exponential Smoothing](https://www.wikiwand.com/en/Exponential_smoothing)を参照してください。範囲は 0 から 1 です。また、時系列の初期値が 0 に偏らないよう、デバイアス項が追加されます。
TWEMA アルゴリズムでは、線上の点の密度 (x 軸上の範囲の単位あたりの `y` 値の数) を考慮します。これにより、特性の異なる複数の線を同時に表示する場合でも、一貫したスムージングを行えます。
以下のサンプル コードは、その内部的な動作を示しています。
```javascript theme={null}
const smoothingWeight = Math.min(Math.sqrt(smoothingParam || 0), 0.999);
let lastY = yValues.length > 0 ? 0 : NaN;
let debiasWeight = 0;
return yValues.map((yPoint, index) => {
const prevX = index > 0 ? index - 1 : 0;
// VIEWPORT_SCALE は結果をチャートの X 軸の範囲にスケールします
const changeInX =
((xValues[index] - xValues[prevX]) / rangeOfX) * VIEWPORT_SCALE;
const smoothingWeightAdj = Math.pow(smoothingWeight, changeInX);
lastY = lastY * smoothingWeightAdj + yPoint;
debiasWeight = debiasWeight * smoothingWeightAdj + 1;
return lastY / debiasWeight;
});
```
このアルゴリズムがライブデータに適用されている例は、[インタラクティブな W\&B report の TWEMA セクション](https://wandb.ai/carey/smoothing-example/reports/W-B-Smoothing-Features--Vmlldzo1MzY3OTc)をご覧ください。
## ガウススムージング
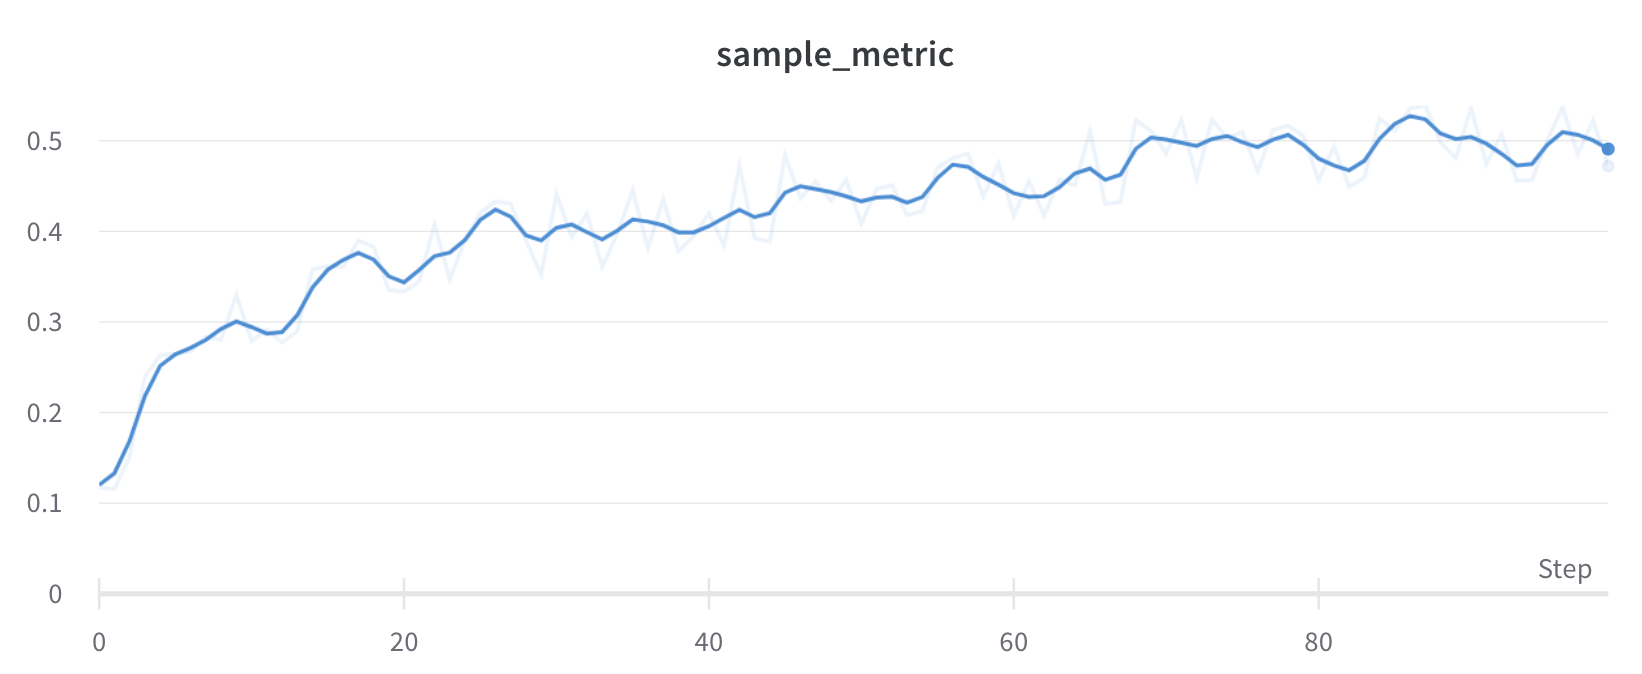
ガウススムージング (またはガウスカーネルスムージング) では、各点の加重平均を計算します。重みには、スムージングパラメーターとして指定した標準偏差を持つガウス分布を用います。W\&B は、各入力 `x` 値について、その前後にある点に基づいてスムージング後の値を計算します。
このアルゴリズムがライブデータに適用される様子を確認するには、[対話型 W\&B report の ガウススムージング セクション](https://wandb.ai/carey/smoothing-example/reports/W-B-Smoothing-Features--Vmlldzo1MzY3OTc#3.-gaussian-smoothing)をご覧ください。
## 移動平均スムージング
移動平均は、指定した `x` 値の前後にあるウィンドウ内の点の平均値で、その点を置き換えるスムージング アルゴリズムです。詳しくは、[Wikipedia の「Boxcar Filter」](https://en.wikipedia.org/wiki/Moving_average)を参照してください。移動平均のパラメーターでは、移動平均の計算に含める点の数を指定します。
点が x 軸上で不均等な間隔で配置されている場合は、代わりにガウス スムージングを使用してください。点の密度が変化すると、幅が固定されたウィンドウでは誤解を招く平均値になる可能性があるためです。
このアルゴリズムがライブ データに適用された例を確認するには、[インタラクティブな W\&B report の移動平均セクション](https://wandb.ai/carey/smoothing-example/reports/W-B-Smoothing-Features--Vmlldzo1MzY3OTc#4.-running-average)を参照してください。
## 指数移動平均 (EMA) スムージング
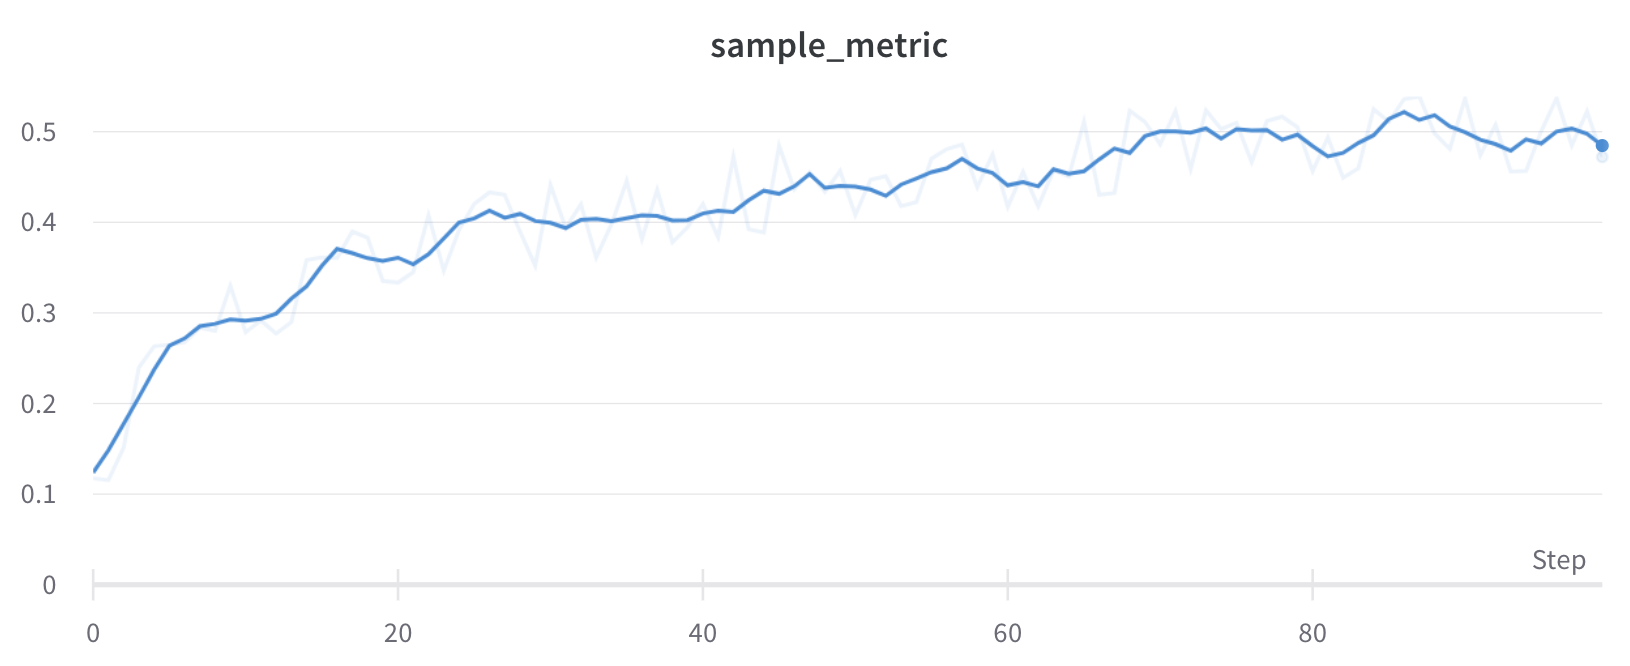
指数移動平均 (EMA) スムージングアルゴリズムは、指数ウィンドウ関数を使って時系列データを平滑化する経験則的な手法です。この手法の詳細については、[Exponential Smoothing](https://www.wikiwand.com/en/Exponential_smoothing)を参照してください。範囲は 0 から 1 です。時系列の初期の値がゼロ方向に偏らないよう、デバイアス項が追加されます。
ほとんどの場合、EMA スムージングは、先にバケット化してからスムージングするのではなく、履歴全体を走査して適用されます。この方法のほうが、通常はより正確なスムージング結果が得られます。
ただし、次のような場合は、EMA スムージングは代わりにバケット化の後に適用されます。
* サンプリング
* グループ化
* 式
* 非単調な x 軸
* 時間ベースの x 軸
以下は、この仕組みが内部でどのように動作するかを示すサンプルコードです。
```javascript theme={null}
data.forEach(d => {
const nextVal = d;
last = last * smoothingWeight + (1 - smoothingWeight) * nextVal;
numAccum++;
debiasWeight = 1.0 - Math.pow(smoothingWeight, numAccum);
smoothedData.push(last / debiasWeight);
```
このアルゴリズムがライブデータに適用された例を確認するには、[インタラクティブな W\&B report の EMA セクション](https://wandb.ai/carey/smoothing-example/reports/W-B-Smoothing-Features--Vmlldzo1MzY3OTc)を参照してください。
## 元のデータを非表示
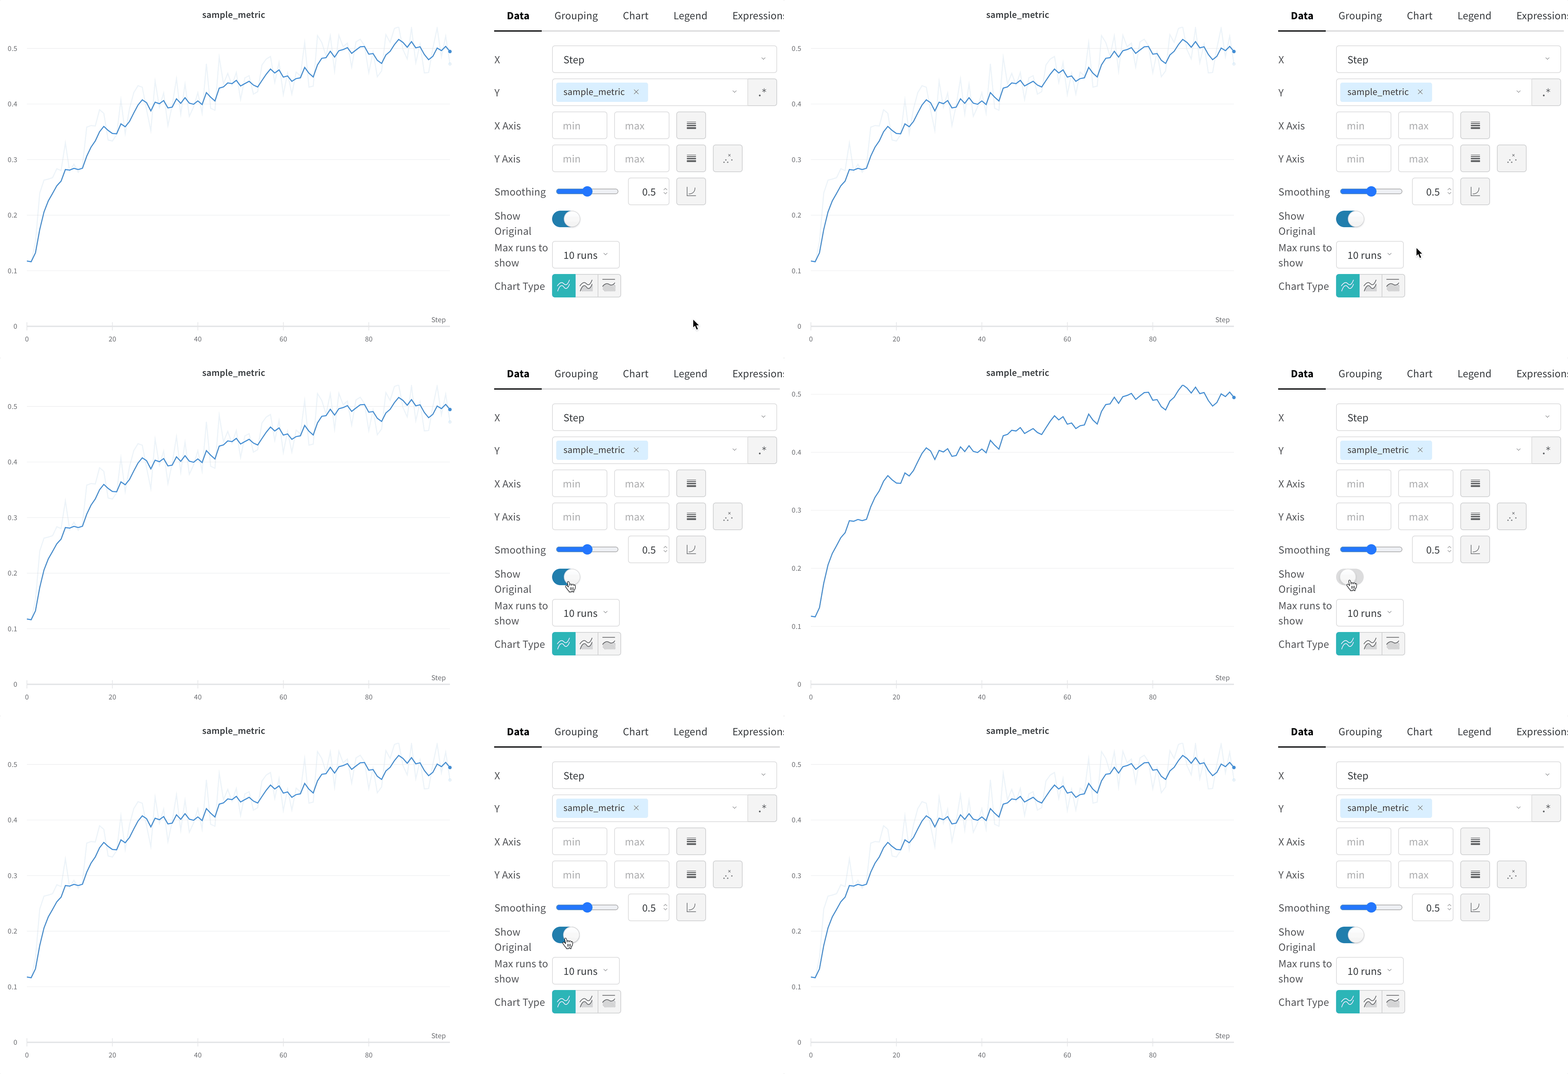
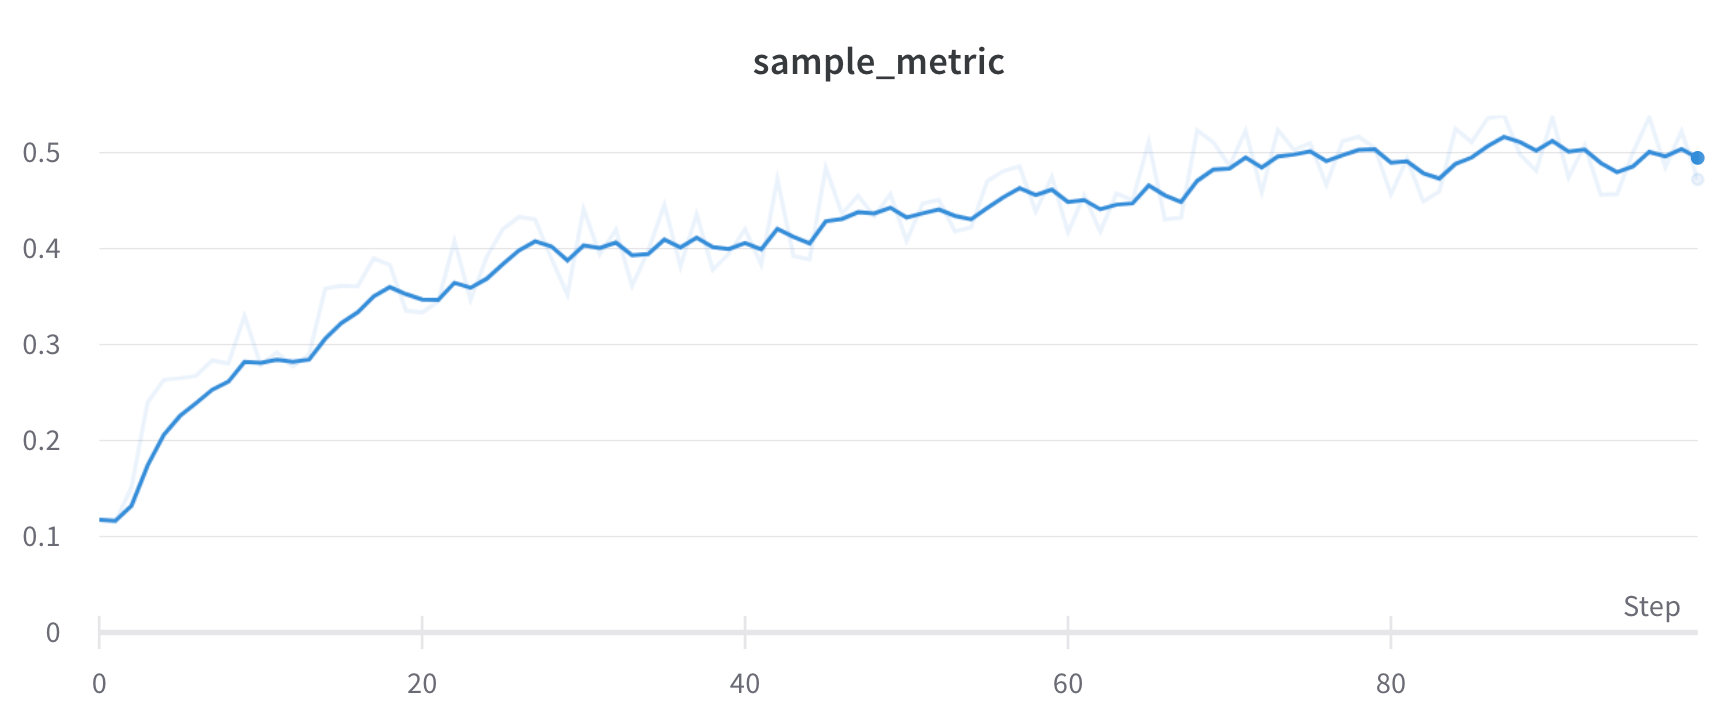
スムージングによって信号がどの程度変化するかを判断するには、スムージングした線を生データと比較します。デフォルトでは、スムージングされていない元のデータが、背景に薄い線としてプロットに表示されます。これを非表示にするには、**Show Original** をクリックします。