> ## Documentation Index
> Fetch the complete documentation index at: https://wb-21fd5541-sdk-testing-latest.mintlify.site/llms.txt
> Use this file to discover all available pages before exploring further.

> 머신 러닝 프로젝트를 위한 관리 및 협업 도구

# Reports Overview

export const TryProductLink = ({url}) => <a href={url} target="_blank" rel="noopener noreferrer" className="github-source-link">
    <svg width="20" height="20" viewBox="0 0 24 24" fill="none" stroke="currentColor" strokeWidth="2" strokeLinecap="round" strokeLinejoin="round" xmlns="http://www.w3.org/2000/svg">
      <line x1="4" y1="21" x2="4" y2="14"></line>
      <line x1="4" y1="10" x2="4" y2="3"></line>
      <line x1="12" y1="21" x2="12" y2="12"></line>
      <line x1="12" y1="8" x2="12" y2="3"></line>
      <line x1="20" y1="21" x2="20" y2="16"></line>
      <line x1="20" y1="12" x2="20" y2="3"></line>
      <circle cx="4" cy="12" r="2"></circle>
      <circle cx="12" cy="10" r="2"></circle>
      <circle cx="20" cy="14" r="2"></circle>
    </svg>
    W&amp;B에서 사용해 보기
  </a>;

export const ColabLink = ({url}) => <a href={url} target="_blank" rel="noopener noreferrer" className="colab-link">
    <svg width="20" height="20" viewBox="0 0 24 24" fill="currentColor" xmlns="http://www.w3.org/2000/svg">
      <path d="M14.25.18l.9.2.73.26.59.3.45.32.34.34.25.34.16.33.1.3.04.26.02.2-.01.13V8.5l-.05.63-.13.55-.21.46-.26.38-.3.31-.33.25-.35.19-.35.14-.33.1-.3.07-.26.04-.21.02H8.77l-.69.05-.59.14-.5.22-.41.27-.33.32-.27.35-.2.36-.15.37-.1.35-.07.32-.04.27-.02.21v3.06H3.17l-.21-.03-.28-.07-.32-.12-.35-.18-.36-.26-.36-.36-.35-.46-.32-.59-.28-.73-.21-.88-.14-1.05-.05-1.23.06-1.22.16-1.04.24-.87.32-.71.36-.57.4-.44.42-.33.42-.24.4-.16.36-.1.32-.05.24-.01h.16l.06.01h8.16v-.83H6.18l-.01-2.75-.02-.37.05-.34.11-.31.17-.28.25-.26.31-.23.38-.2.44-.18.51-.15.58-.12.64-.1.71-.06.77-.04.84-.02 1.27.05zm-6.3 1.98l-.23.33-.08.41.08.41.23.34.33.22.41.09.41-.09.33-.22.23-.34.08-.41-.08-.41-.23-.33-.33-.22-.41-.09-.41.09zm13.09 3.95l.28.06.32.12.35.18.36.27.36.35.35.47.32.59.28.73.21.88.14 1.04.05 1.23-.06 1.23-.16 1.04-.24.86-.32.71-.36.57-.4.45-.42.33-.42.24-.4.16-.36.09-.32.05-.24.02-.16-.01h-8.22v.82h5.84l.01 2.76.02.36-.05.34-.11.31-.17.29-.25.25-.31.24-.38.2-.44.17-.51.15-.58.13-.64.09-.71.07-.77.04-.84.01-1.27-.04-1.07-.14-.9-.2-.73-.25-.59-.3-.45-.33-.34-.34-.25-.34-.16-.33-.1-.3-.04-.25-.02-.2.01-.13v-5.34l.05-.64.13-.54.21-.46.26-.38.3-.32.33-.24.35-.2.35-.14.33-.1.3-.06.26-.04.21-.02.13-.01h5.84l.69-.05.59-.14.5-.21.41-.28.33-.32.27-.35.2-.36.15-.36.1-.35.07-.32.04-.28.02-.21V6.07h2.09l.14.01.21.03zm-6.47 14.25l-.23.33-.08.41.08.41.23.33.33.23.41.08.41-.08.33-.23.23-.33.08-.41-.08-.41-.23-.33-.33-.23-.41-.08-.41.08z" />
    </svg>
    Colab에서 사용해 보기
  </a>;

<CardGroup cols={4}>
  <ColabLink url="https://colab.research.google.com/github/wandb/examples/blob/master/colabs/intro/Report_API_Quickstart.ipynb" />

  <TryProductLink url="https://wandb.ai/stacey/deep-drive/reports/The-View-from-the-Driver-s-Seat--Vmlldzo1MTg5NQ?utm_source=fully_connected&utm_medium=blog&utm_campaign=view+from+the+drivers+seat" />
</CardGroup>

W\&B Reports를 사용하면 다음을 할 수 있습니다:

* Runs를 정리합니다.
* 시각화를 임베드하고 자동화합니다.
* 분석 결과를 설명합니다.
* 업데이트 내용을 LaTeX zip 파일이나 PDF로 공동 작업자와 공유합니다.

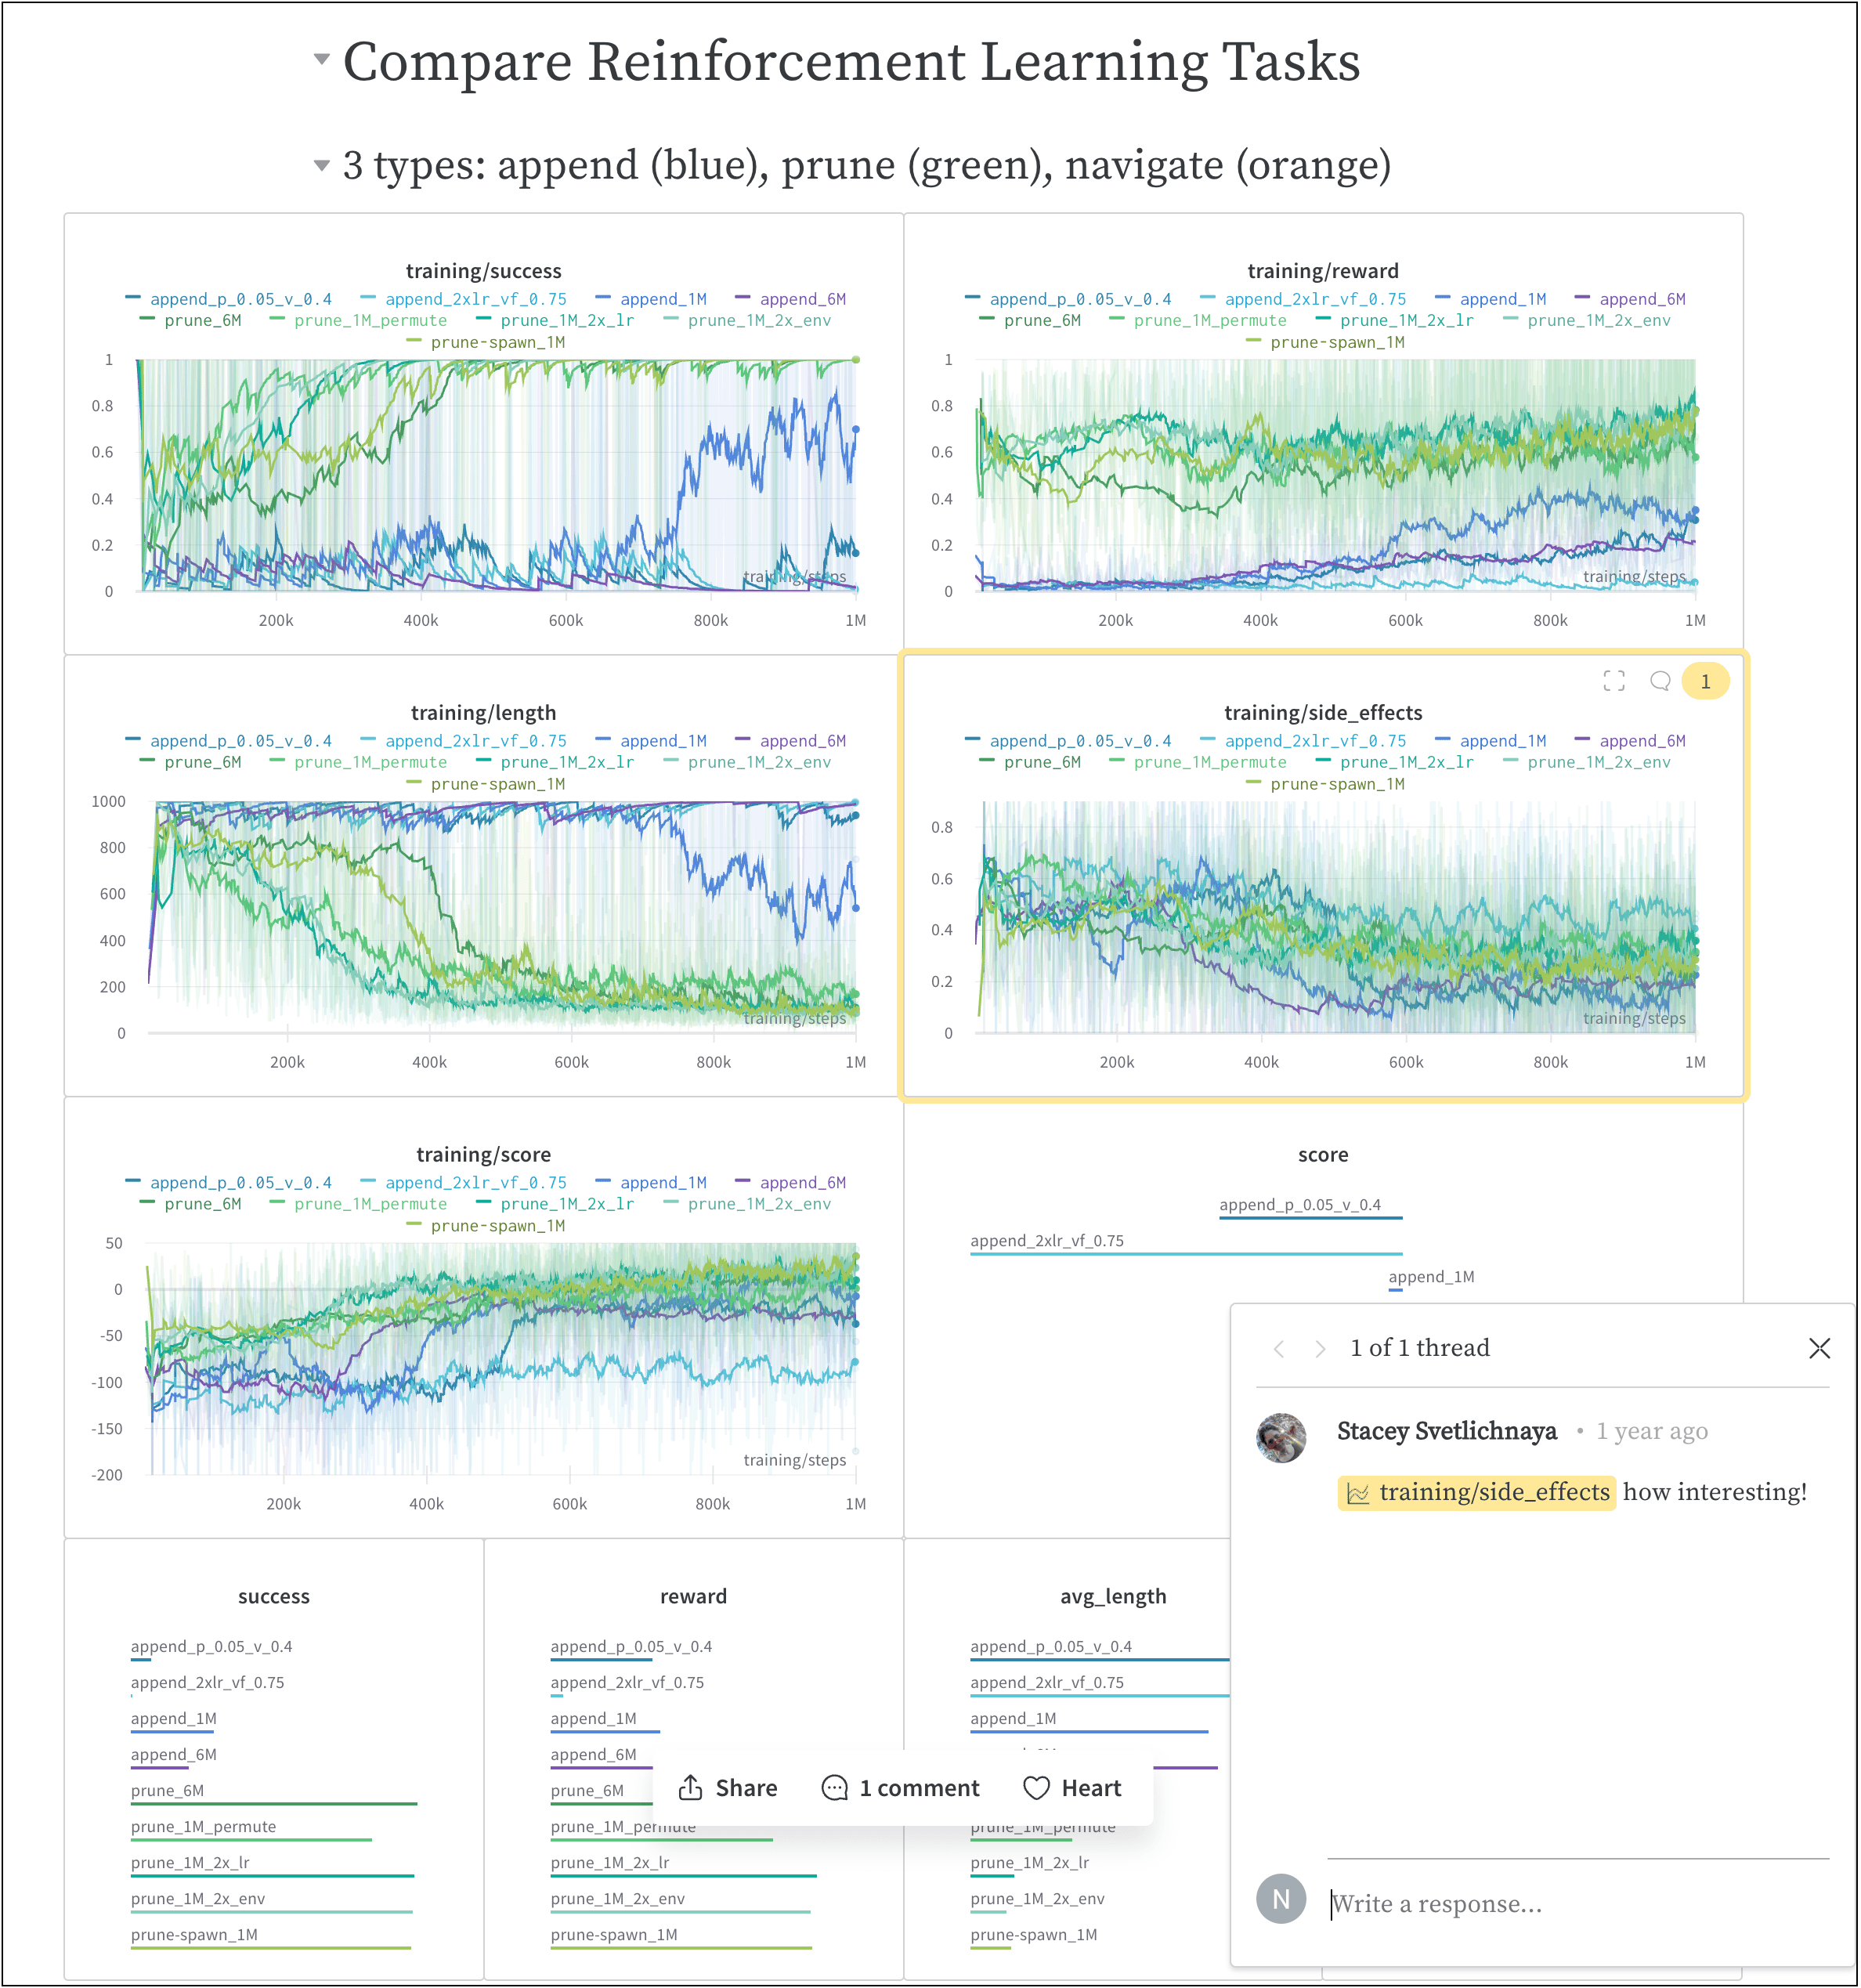
다음 이미지는 트레이닝하는 동안 W\&B에 로깅된 메트릭으로 생성한 리포트의 한 섹션을 보여줍니다.

<Frame>
  <img src="https://mintcdn.com/wb-21fd5541-sdk-testing-latest/H06KgVKW2CsyczDM/images/reports/safe-lite-benchmark-with-comments.png?fit=max&auto=format&n=H06KgVKW2CsyczDM&q=85&s=c358b51ae3594d5d5af0fbf034829e15" alt="벤치마크 결과가 포함된 W&B 리포트" max-width="90%" width="2376" height="2538" data-path="images/reports/safe-lite-benchmark-with-comments.png" />
</Frame>

위 이미지가 포함된 리포트는 [여기](https://wandb.ai/stacey/saferlife/reports/SafeLife-Benchmark-Experiments--Vmlldzo0NjE4MzM)에서 확인할 수 있습니다.

<div id="how-it-works">
  ## 작동 방식
</div>

몇 번만 클릭하면 협업 리포트를 만들 수 있습니다.

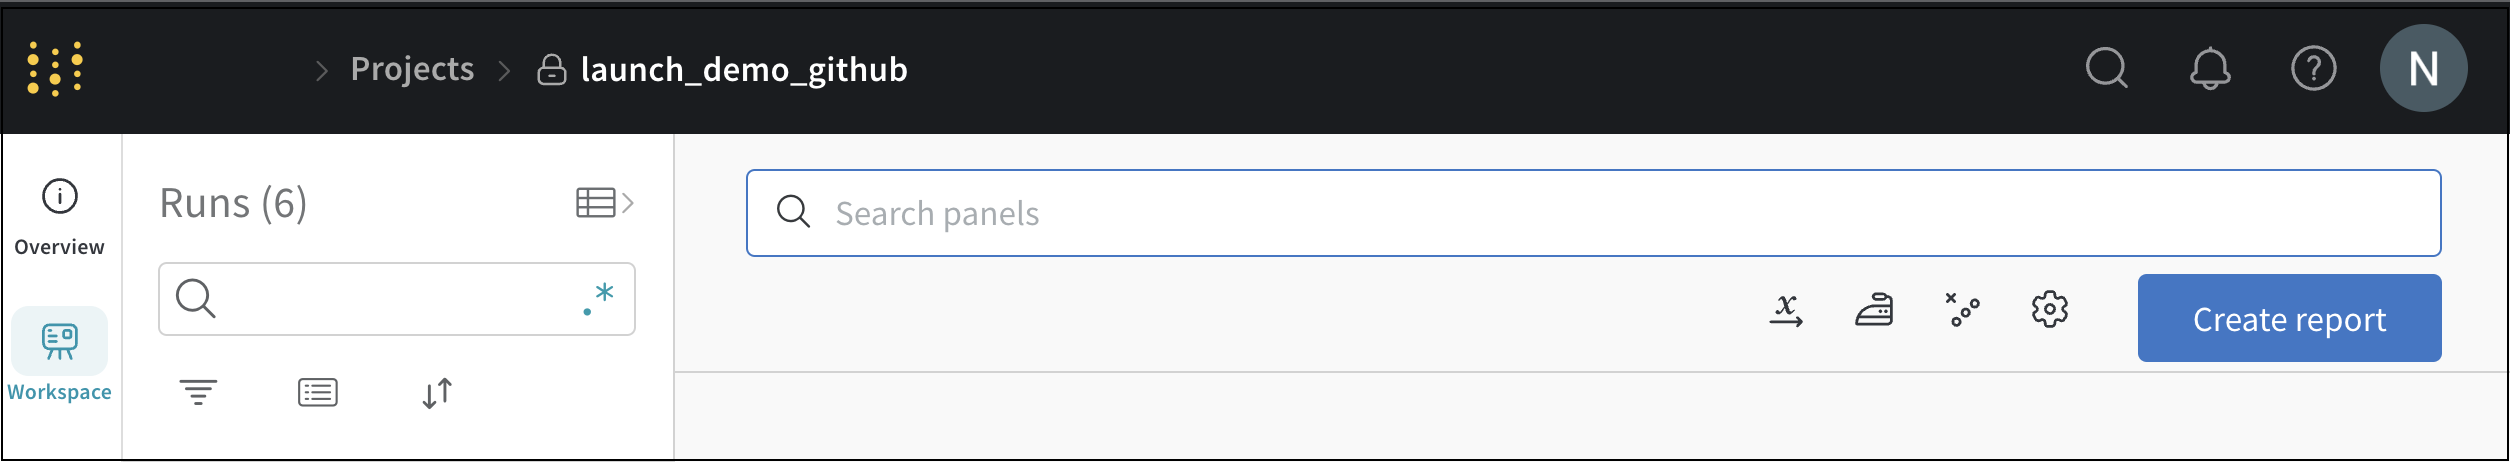
1. W\&B App에서 W\&B 프로젝트 워크스페이스로 이동합니다.
2. 워크스페이스 오른쪽 상단의 **리포트 만들기** 버튼을 클릭합니다.

<Frame>
  <img src="https://mintcdn.com/wb-21fd5541-sdk-testing-latest/9bGjVEZnWlpBI-9p/images/reports/create_a_report_button.png?fit=max&auto=format&n=9bGjVEZnWlpBI-9p&q=85&s=4d8e5ca6fe003e8536c688986a28210f" alt="리포트 만들기 버튼" max-width="90%" width="2510" height="462" data-path="images/reports/create_a_report_button.png" />
</Frame>

3. **리포트 만들기**라는 제목의 모달이 나타납니다. 리포트에 추가할 차트와 패널을 선택합니다. (차트와 패널은 나중에 추가하거나 제거할 수 있습니다).
4. **리포트 만들기**를 클릭합니다.
5. 원하는 형태로 리포트를 편집합니다.
6. **프로젝트에 게시**를 클릭합니다.
7. **공유** 버튼을 클릭해 협업자와 리포트를 공유합니다.

W\&B Python SDK를 사용해 대화형 및 프로그래밍 방식으로 리포트를 만드는 방법에 대한 자세한 내용은 [리포트 만들기](/ko/models/reports/create-a-report/) 페이지를 참조하세요.

<div id="how-to-get-started">
  ## 시작하기
</div>

사용 사례에 따라 W\&B Reports를 시작하는 데 도움이 되는 다음 리소스를 살펴보세요.

* W\&B Reports의 개요를 보려면 [비디오 데모](https://www.youtube.com/watch?v=2xeJIv_K_eI)를 확인하세요.
* 라이브 리포트 예시는 [Reports gallery](/ko/models/reports/reports-gallery/)에서 살펴보세요.
* 워크스페이스를 만들고 사용자 지정하는 방법을 알아보려면 [Programmatic Workspaces](https://colab.research.google.com/github/wandb/wandb-workspaces/blob/Update-wandb-workspaces-tuturial/Workspace_tutorial.ipynb) 노트북을 사용해 보세요.
* [W\&B Fully Connected](https://wandb.me/fc)에서 엄선된 Reports를 읽어보세요.

<div id="recommended-practices-and-tips">
  ## 권장 모범 사례 및 팁
</div>

Experiments 및 logging에 대한 모범 사례와 팁은 [모범 사례: Reports](https://wandb.ai/wandb/pytorch-lightning-e2e/reports/W-B-Best-Practices-Guide--VmlldzozNTU1ODY1#reports)을 참조하세요.
