> ## Documentation Index
> Fetch the complete documentation index at: https://wb-21fd5541-sdk-testing-latest.mintlify.site/llms.txt
> Use this file to discover all available pages before exploring further.
> Create a W&B Report with the W&B App or programmatically.
# Create a report
W\&B Report and Workspace API is in Public Preview.
W\&B Reports let you share findings, results, and visualizations from your runs with collaborators. Create a report from a project workspace, from the **Reports** tab, or programmatically with the Report and Workspace API. Select a tab to get started.
For a programmatic example, see the [Report API Quickstart Google Colab](https://colab.research.google.com/github/wandb/examples/blob/master/colabs/intro/Report_API_Quickstart.ipynb).
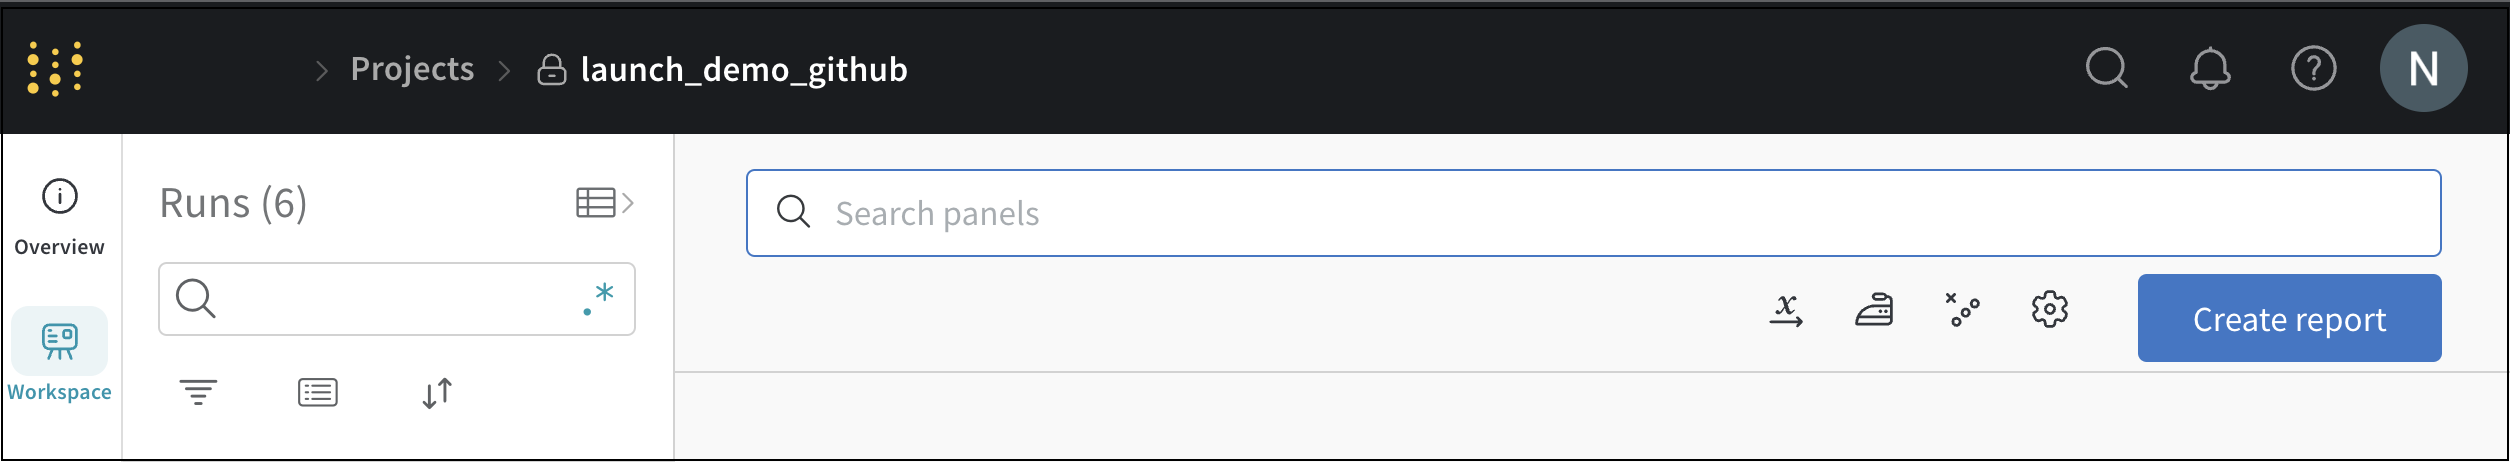
1. Navigate to your project workspace in the W\&B App.
2. In the upper-right corner of your workspace, click **Create report**.
 3. A modal appears. Select the charts you want to start with. You can add or remove charts later from the report interface.
 4. To prevent W\&B from adding more runs to your report, select **Filter run sets**. W\&B saves a draft report automatically. Access it in the **Reports** tab.
1. Navigate to your project workspace in the W\&B App.
2. Select the **Reports** tab in your project.
3. Click **Create report**.
4. To prevent W\&B from adding more runs to your report, select **Filter run sets**. W\&B saves a draft report automatically. Access it in the **Reports** tab.
1. Navigate to your project workspace in the W\&B App.
2. Select the **Reports** tab in your project.
3. Click **Create report**.
 Create a report programmatically:
1. Install the W\&B SDK (`wandb`) and the Report and Workspace API (`wandb-workspaces`):
```bash theme={null}
pip install wandb wandb-workspaces
```
2. Import the W\&B Python SDK and the Report and Workspace API:
```python theme={null}
import wandb
import wandb_workspaces.reports.v2 as wr
```
3. Create a report instance with `wandb_workspaces.reports.v2.Report` or with the Report Class Public API ([`wandb.apis.reports`](/models/ref/python/public-api/api#reports)). Specify the project to associate with the report:
```python theme={null}
report = wr.Report(project="report_standard")
```
4. Save the report. W\&B doesn't upload reports until you call the `.save()` method:
```python theme={null}
report.save()
```
For more information, see [Edit a report](/models/reports/edit-a-report).
Create a report programmatically:
1. Install the W\&B SDK (`wandb`) and the Report and Workspace API (`wandb-workspaces`):
```bash theme={null}
pip install wandb wandb-workspaces
```
2. Import the W\&B Python SDK and the Report and Workspace API:
```python theme={null}
import wandb
import wandb_workspaces.reports.v2 as wr
```
3. Create a report instance with `wandb_workspaces.reports.v2.Report` or with the Report Class Public API ([`wandb.apis.reports`](/models/ref/python/public-api/api#reports)). Specify the project to associate with the report:
```python theme={null}
report = wr.Report(project="report_standard")
```
4. Save the report. W\&B doesn't upload reports until you call the `.save()` method:
```python theme={null}
report.save()
```
For more information, see [Edit a report](/models/reports/edit-a-report).