> ## Documentation Index
> Fetch the complete documentation index at: https://wb-21fd5541-sdk-testing-latest.mintlify.site/llms.txt
> Use this file to discover all available pages before exploring further.
# Trace your code
> Instrument your running code so its execution appears as detailed traces in W&B Weave.
This guide shows you how to instrument your application so that its execution appears as detailed traces in W\&B Weave. Traces help you debug, evaluate, and monitor LLM-powered code by capturing inputs, outputs, and the structure of each operation as a Call.
To see your running code as detailed traces in Weave, you create Calls. The following sections describe the three main ways to do this, from least to most manual:
* Automatic tracking of LLM library calls.
* Tracking of custom functions with `weave.op`.
* Manual Call tracking using the API directly.
Choose the approach that fits how much control you need over what gets traced.
## Automatic tracking of LLM library calls
Weave integrates automatically with many common libraries and frameworks, such as `openai`, `anthropic`, `cohere`, `mistral`, and `LangChain`. Import the LLM or framework library and initialize your Weave project. Weave then automatically traces all Calls made to the LLM or platform to your project without any additional code changes. For a complete list of supported library integrations, see [Integrations overview](/weave/guides/integrations/).
```python lines theme={null}
import weave
from openai import OpenAI
client = OpenAI()
# Initialize Weave Tracing
weave.init('intro-example')
response = client.chat.completions.create(
model="gpt-4",
messages=[
{
"role": "user",
"content": "How are you?"
}
],
temperature=0.8,
max_tokens=64,
top_p=1,
)
```
```typescript twoslash lines theme={null}
// @noErrors
import OpenAI from 'openai'
import * as weave from 'weave'
const client = new OpenAI()
// Initialize Weave Tracing
await weave.init('intro-example')
const response = await client.chat.completions.create({
model: 'gpt-4',
messages: [
{
role: 'user',
content: 'How are you?',
},
],
temperature: 0.8,
max_tokens: 64,
top_p: 1,
});
```
For a complete setup guide for JavaScript and TypeScript projects, see the [TypeScript SDK: Third-Party Integration Guide](/weave/guides/integrations/js).
If you want more control over automatic behavior, see [Configure automatic LLM call tracking](/weave/guides/integrations/autopatching).
## Track custom functions
LLM applications often have additional logic, such as pre-processing and post-processing, prompts, and more, that you want to track. Use this approach when you want Weave to capture your own functions alongside the LLM calls it traces automatically.
Weave lets you manually track these Calls using the [`@weave.op`](/weave/reference/python-sdk/#function-op) decorator. For example:
```python lines theme={null}
import weave
# Initialize Weave Tracing
weave.init('intro-example')
# Decorate your function
@weave.op
def my_function(name: str):
return f"Hello, {name}!"
# Call your function -- Weave will automatically track inputs and outputs
print(my_function("World"))
```
You can also track [methods on classes](#track-class-and-object-methods).
Weave lets you manually track these Calls by wrapping your function with [`weave.op`](/weave/reference/typescript-sdk/functions/op). For example:
```typescript twoslash lines theme={null}
// @noErrors
import * as weave from 'weave'
await weave.init('intro-example')
function myFunction(name: string) {
return `Hello, ${name}!`
}
const myFunctionOp = weave.op(myFunction)
```
You can also define the wrapping inline:
```typescript twoslash lines theme={null}
// @noErrors
const myFunctionOp = weave.op((name: string) => `Hello, ${name}!`)
```
This works for both functions and methods on classes:
```typescript twoslash lines theme={null}
// @noErrors
class MyClass {
constructor() {
this.myMethod = weave.op(this.myMethod)
}
myMethod(name: string) {
return `Hello, ${name}!`
}
}
```
### Track class and object methods
In addition to standalone functions, you can track class and object methods. You can track any method in a class by decorating the method with `weave.op`.
```python lines theme={null}
import weave
# Initialize Weave Tracing
weave.init("intro-example")
class MyClass:
# Decorate your method
@weave.op
def my_method(self, name: str):
return f"Hello, {name}!"
instance = MyClass()
# Call your method -- Weave will automatically track inputs and outputs
print(instance.my_method("World"))
```
**Using decorators in TypeScript**
To use the `@weave.op` decorator with your TypeScript code, make sure your environment is properly configured:
* **TypeScript v5.0 or newer**: Decorators are supported out of the box and no additional configuration is required.
* **TypeScript older than v5.0**: Enable experimental support for decorators. For more details, see the [official TypeScript documentation on decorators](https://www.typescriptlang.org/docs/handbook/decorators.html).
You can apply `@weave.op` to instance methods for tracing.
```typescript twoslash lines theme={null}
// @noErrors
class Foo {
@weave.op
async predict(prompt: string) {
return "bar"
}
}
```
You can also apply `@weave.op` to static methods to monitor utility functions within a class.
```typescript twoslash lines theme={null}
// @noErrors
class MathOps {
@weave.op
static square(n: number): number {
return n * n;
}
}
```
### Trace parallel (multi-threaded) function calls
By default, parallel Calls all appear in Weave as separate root Calls, which makes the trace hierarchy hard to follow. To get correct nesting under the same parent Op, use a `ThreadPoolExecutor`.
The following code sample demonstrates the use of [`ThreadPoolExecutor`](/weave/reference/python-sdk/trace/util#class-contextawarethreadpoolexecutor).
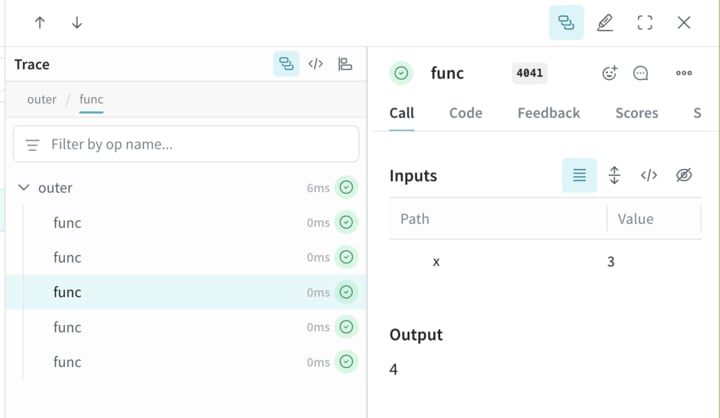
The first function, `func`, is a simple Op that takes `x` and returns `x+1`. The second function, `outer`, is another Op that accepts a list of inputs.
Inside `outer`, the use of `ThreadPoolExecutor` and `exc.map(func, inputs)` means that each call to `func` still carries the same parent trace context.
```python lines theme={null}
import weave
@weave.op
def func(x):
return x+1
@weave.op
def outer(inputs):
with weave.ThreadPoolExecutor() as exc:
exc.map(func, inputs)
# Update your Weave project name
client = weave.init('my-weave-project')
outer([1,2,3,4,5])
```
```text theme={null}
This feature is not available in the TypeScript SDK yet.
```
In the Weave UI, this produces a single parent Call with five nested child Calls. You get a fully hierarchical trace even though the increments run in parallel.
 ## Manual Call tracking
If neither automatic integration nor the `weave.op` decorator fits your workflow, you can manually create Calls using the API directly. This approach gives you full control over when a Call starts and ends, at the cost of more boilerplate.
```python lines theme={null}
import weave
# Initialize Weave Tracing
client = weave.init('intro-example')
def my_function(name: str):
# Start a Call
call = client.create_call(op="my_function", inputs={"name": name})
# ... your function code ...
# End a Call
client.finish_call(call, output="Hello, World!")
# Call your function
print(my_function("World"))
```
```text theme={null}
This feature is not available in the TypeScript SDK yet.
```
* Start a Call: [POST `/call/start`](https://docs.wandb.ai/weave/reference/service-api/calls/call-start).
* End a Call: [POST `/call/end`](https://docs.wandb.ai/weave/reference/service-api/calls/call-end).
```bash lines theme={null}
curl -L 'https://trace.wandb.ai/call/start' \
-H 'Content-Type: application/json' \
-H 'Accept: application/json' \
-d '{
"start": {
"project_id": "string",
"id": "string",
"op_name": "string",
"display_name": "string",
"trace_id": "string",
"parent_id": "string",
"started_at": "2024-09-08T20:07:34.849Z",
"attributes": {},
"inputs": {},
"wb_run_id": "string"
}
}
```
## Manual Call tracking
If neither automatic integration nor the `weave.op` decorator fits your workflow, you can manually create Calls using the API directly. This approach gives you full control over when a Call starts and ends, at the cost of more boilerplate.
```python lines theme={null}
import weave
# Initialize Weave Tracing
client = weave.init('intro-example')
def my_function(name: str):
# Start a Call
call = client.create_call(op="my_function", inputs={"name": name})
# ... your function code ...
# End a Call
client.finish_call(call, output="Hello, World!")
# Call your function
print(my_function("World"))
```
```text theme={null}
This feature is not available in the TypeScript SDK yet.
```
* Start a Call: [POST `/call/start`](https://docs.wandb.ai/weave/reference/service-api/calls/call-start).
* End a Call: [POST `/call/end`](https://docs.wandb.ai/weave/reference/service-api/calls/call-end).
```bash lines theme={null}
curl -L 'https://trace.wandb.ai/call/start' \
-H 'Content-Type: application/json' \
-H 'Accept: application/json' \
-d '{
"start": {
"project_id": "string",
"id": "string",
"op_name": "string",
"display_name": "string",
"trace_id": "string",
"parent_id": "string",
"started_at": "2024-09-08T20:07:34.849Z",
"attributes": {},
"inputs": {},
"wb_run_id": "string"
}
}
```